

The Untapped Hydrogen Series
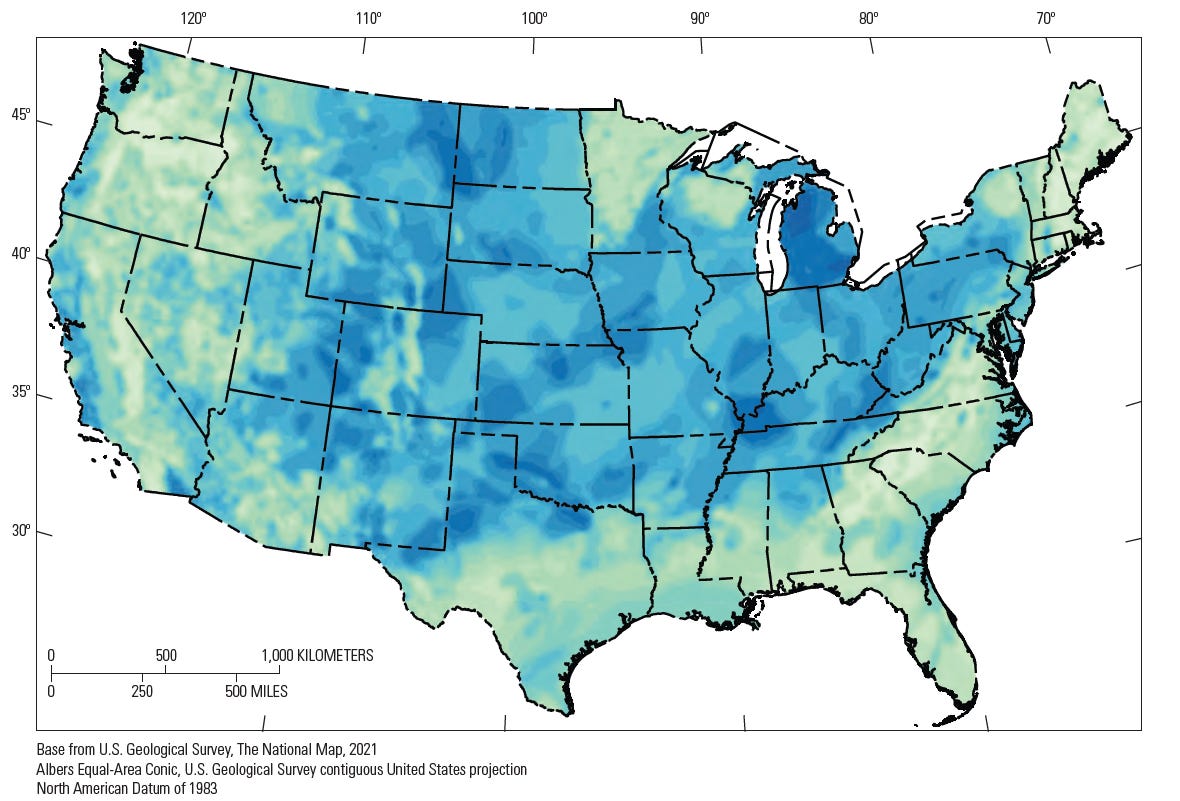
The highest score anywhere on the U.S. Geological Survey’s first geologic hydrogen map is 0.85. The average across the lower 48 is 0.54, and no location scores a full 1 or a 0. The authors compare a value of 0.5 to a coin toss, meaning it may carry no actual weight in either direction.1
That isn’t an anticlimax, and it is the most important thing about the map. The USGS published it in January 2025 as the first continental-scale map of its kind.2 This was built to rank where to look, not to say what is there. Article One in this series argued that natural hydrogen is a real geological category, in its own right, with yet another reference to a colour chart which has outgrown its usefulness. This article asks what investors can and cannot do with the first serious attempt to say where the hydrogen might be.
From a global model to a national map
The map has a parent. In late-2024, USGS geologists Geoffrey Ellis and Sarah Gelman published a global mass-balance model in Science Advances. From its most probable estimates, the bulk of this hydrogen in place is about 5.6 million million tonnes, inside an uncertainty range from 10³ to 10¹⁰ million tonnes. That is roughly seven orders of magnitude.
The authors expect most of it to be unrecoverable. If 2 percent of the most probable amount could be recovered, that would be about 100,000 million tonnes, with roughly twice the energy of all proven natural gas reserves. Annual natural generation is put at roughly 15 to 31 million tonnes, against projected demand near 530 million tonnes a year by 2050.3 So the case rests on stored accumulations, not on “renewable” flow, and that’s an important reference point for future forecasting endeavours.
The USGS has stated plainly that a model doesn’t predict how or where the hydrogen is distributed in the subsurface, and that much of it is likely too deep, too far offshore, or in accumulations too small to recover economically. The map process was only the next step: where might the ingredients stack up?
How the map is built
It borrows directly from petroleum-system logic. A prospective area needs a hydrogen source, porous rock to store it, and a seal to stop leakage. Each component receives a “chance of sufficiency” (COS) score. The map’s prospectivity value is the product of the three: source × reservoir × seal. If any component is zero, the whole location is zero.
The inputs are 21 geological and geophysical layers, including ultramafic rocks, failed rifts, Precambrian craton, uranium-bearing rocks, faults, heat flow and sedimentary basins. The COS values were assigned by expert elicitation, with a panel of six sub-surface specialists reviewing them, then run through an additional 5,000 Monte Carlo simulations.
The highest values fall in Michigan, parts of Kansas, north Texas, southern Oklahoma, the western Williston Basin, and the Four Corners region. A zone spanning western Kentucky and southern Illinois reaches 0.85. The same USGS release also flags the mid-continent, the Four Corners states, the California coast and areas alongst the Eastern seaboard.
What the map tells capital
It is a screening tool for acreage. It answers “where do the geological prerequisites overlap?” with a reproducible method. The data behind it are open: 44 raster files under a CC0 release4, plus an interactive Map Explorer with 19 input maps and 7 integrated maps.5 Anyone can re-weight the layers and see how the answer moves.
It shows the midcontinent rift as the strongest onshore theme. The report ties the highest scores to places where serpentinisation sources overlap the North American craton, including the midcontinent rift. It also notes that modeled migration paths from the rift point toward wells that already showed hydrogen, including Kansas’ Nemaha High and Iowa’s Hofmann #3 well at 96 mol%.
Its source layer matters even where reservoirs don’t. The authors say the source-only map is especially useful for strategies which capture seeping hydrogen or stimulate generation, because reservoirs and seals aren’t needed there. That is relevant to the stimulated-hydrogen section below.
What it explicitly does not tell them
It is not a resource estimate. Because no volumes are known for subsurface hydrogen occurrences, “sufficiency” isn’t tied to any volume. A COS of 0.5 also does not mean half of wells in that spot will find hydrogen. It works at the play scale, not the prospect scale. Traps, reservoir temperatures, biotic and abiotic consumption, and the detailed migration and mixing were left out, because they are hard to map at continental scale. These reports also says preservation could become a fourth component later, since hydrogen is so reactive.
Its inputs are simplified and judgment-based. Serpentinisation6 is also scored from a presence of ultramafic rock, without accounting for water or temperature, as reservoir and seal are proxied largely by whether sedimentary rock is present. The authors say results depend more on the relative COS values than the absolute ones, and that the values may change as knowledge grows.
As a result, its calibration data are thin and usually biased. Past hydrogen discoveries were mostly accidental, and the standard mud-gas logging doesn’t routinely measure hydrogen, so many occurrences likely went unrecorded. The report also says little has been published on what controls where hydrogen occurrences appear, so the level of predictability remains low.7 Therefore, synergies and agreements between these maps and a few scattered wells is a consistency check, not a back-test.
More importantly, it says nothing about economics. Depth, flow rates, purity, declines and recharge aren’t in the model.
A live test: Kansas
Kansas sits inside the map’s highest-scoring theme, which has made it a fair test case. HyTerra’s Nemaha wells returned mud-gas hydrogen concentrations as high as 96.1%, with a step-out well showing up to 83%.8 Those numbers excited investors.
The production test at McCoy-1 has since been reported fully.9 The first zone flowed at about 0.1 Mscf/d with low gas saturation, so the company paused its second-zone test. It also said preliminary interpretation suggested that the hydrogen and methane readings may have been influenced by secondary wellbore processes.10 The company stresses that this was only one location in its Ridge Play, and it’s advancing its efforts, closer to the rift source rocks, in parallel.
A note on sourcing: that summary is a secondary write-up of the company’s exchange announcement, and the primary filing should be consulted before anyone relies on its numbers. Even so, the lesson is direct. A rock which shows hydrogen in drilling mud is not a well that flows through it, and the map cannot tell the two apart.
Underwriting an exploration-stage resource
The map compresses several distinct risks into one colour scale, and an underwriter needs to pull them apart:
Presence risk: is hydrogen there at all? The map addresses this, roughly.
Retention risk: is it trapped and preserved? The map only proxies this.
Deliverability risk: what rate, purity and duration? The map is silent. One recent analysis sets the commercial bar at flow rates about an order of magnitude above typical natural seeps, at 90 percent-plus purity, sustained for 20 to 30 years.11
Persistence risk: does it recharge or deplete? The evidence is thin. In Mali, the exact source of the hydrogen, and whether it is replenished over long timescales, is unknown.12
Commercial-chain risk: purification, offtake, and land access. In the U.S., exploration rights sit with landowners, so projects are built on fixed-term leases.13
On the only proven case: Hydroma itself describes the Bourakébougou electricity project as a “non-commercial pilot” that ran for more than seven years.14 That is a proof of flow and purity at village scale, not a commercial precedent. The first hard data from wells in France, Idaho and Kansas is expected over 2026–2028. The McCoy-1 result shows that data can arrive in modest form.
Article Three takes one operator’s exploration program in Saskatchewan and tests it against the framework: presence, retention, deliverability, persistence, and commercial chain, with the unresolved items marked as such.
Where GH2E fits, and where it doesn’t
The GH2E does not retrieve natural hydrogen. It’s a waste-to-hydrogen-and-water platform, and nothing in this series’ evidence suggests it can substitute for a well. The narrower question is where an integrated waste-and-water system could plug into a natural-hydrogen play which is actually being developed. Three interfaces are worth examining, in descending order of evidential support.
1. Water for stimulated hydrogen, and the water that comes back. Stimulation injects water into iron-rich rock. Its proponents argue that seawater or even wastewater can be used, easing water cost.15 The Oman pilot injected about 4,800 cubic meters, shut the well in for a year, and then flowed roughly equal volumes of gas and water.16 The map’s source-only layer is a proper screen for this concept, which has been noted in the earlier sections. Conditioning injectate and handling returns is a treatment-as-a-service problem, which is Track A territory. Unresolved: whether electrocoagulation by-products are compatible with reactive rock and reservoir chemistry, and whether pilot volumes scale. Stimulated hydrogen itself remains unproven at commercial rates.
2. Surface infrastructure at a natural-hydrogen site. Early well gas is mixed. McCoy-1 reported hydrogen, methane, nitrogen and 2.8% helium.17 Waste-derived hydrogen could in principle share purification, compression and offtake with a natural-hydrogen well, keeping that infrastructure utilised while early well flows are proven or decline. This is a concept, not a demonstrated design. It is also Track B territory, so it inherits Track B’s open questions, and a natural-hydrogen success does nothing to resolve them.
3. A siting overlay. The USGS map rasters are distributed under a Creative Commons (CC0) license.18 19Overlaying source-COS with waste streams and water demand is a desk study that could be done now. It would identify candidate sites, not for deploy anything at this stage.
Only the third is available today at low cost. Neither direction of inference holds: a natural-hydrogen success would not validate the GH2E, and GH2E does not de-risk exploration.
Every prospectivity map answers the same narrow question: where might it be worth looking? None of them answer the question that capital actually needs — how much is there, and can it be produced for thirty years at a price that clears? The USGS map was never built to close that gap, and pretending otherwise is how a coin-toss score of 0.5 gets mistaken for a green light.
McCoy-1 is the current data point on how that mistake gets made and corrected in real time — a step-out well that returned 96% hydrogen in the mud logs and 0.1 Mscf/d in the field.
The next test case sits in Saskatchewan, where one operator’s exploration program is far enough along to check against the five risks laid out here. Article Three does that — presence, retention, deliverability, persistence, and commercial chain — and marks the gaps instead of filling them in.
Sources and references
Gelman, Hearon & Ellis, Prospectivity Mapping for Geologic Hydrogen, USGS Professional Paper 1900 (2025): https://doi.org/10.3133/pp1900
USGS, “USGS releases first-ever map of potential for geologic hydrogen in U.S.” (Jan 16, 2025): https://www.usgs.gov/news/national-news-release/usgs-releases-first-ever-map-potential-geologic-hydrogen-us
Ellis & Gelman, “Model predictions of global geologic hydrogen resources,” Science Advances 10 (2024): https://doi.org/10.1126/sciadv.ado0955
Hearon et al., data release for PP 1900 (CC0): https://doi.org/10.5066/P13WCG5U
USGS Geologic Hydrogen Prospectivity Map Explorer: https://www.usgs.gov/tools/geologic-hydrogen-prospectivity-map-explorer
Serpentinisation is the low-temperature hydration and metamorphic transformation of ferromagnesian minerals, such as olivine and pyroxene, in ultramafic and mafic rocks into serpentine minerals, brucite, magnetite, and talc. This process often occurs at temperatures between 0°C and 600°C and results in a significant volume expansion of 30-40%, a density reduction, and the release of hydrogen gas (H2) and heat.
Gelman, Hearon & Ellis, Prospectivity Mapping for Geologic Hydrogen, USGS Professional Paper 1900 (2025): https://doi.org/10.3133/pp1900
Drilling for Hydrogen, “Kansas test looms” (2026): https://www.drilling-for-hydrogen.com/news/kansas-could-kick-start-the-hydrogen-gold-rush
Following initial exploration, HyTerra conducted production testing at McCoy-1 in mid-2026 to appraise steady-state gas flow rates and commercial viability. While the first test zone yielded modest flow (approx. 0.1 Mscf/d) and low gas saturation, the data provided critical insights for refining future exploration strategies, particularly for the larger Rift Play targets. https://www.tipranks.com/news/company-announcements/hyterras-mccoy-1-test-refines-strategy-for-kansas-hydrogen-plays
TipRanks summary of HyTerra’s McCoy-1 announcement (Aug 2026) (secondary source): https://www.tipranks.com/news/company-announcements/hyterras-mccoy-1-test-refines-strategy-for-kansas-hydrogen-plays
Geoscopy, “White Hydrogen: The Geological Gold Rush…” (May 2026), citing Franke et al. (2026) (secondary source): https://geoscopy.com/white-hydrogen-the-geological-gold-rush-for-the-fuel-hiding-under-lorraine-mali-and-kansas/
Geoscientist Online, “Natural hydrogen: the new frontier” (2022): https://geoscientist.online/sections/unearthed/natural-hydrogen-the-new-frontier/
45-8 Energy, Humboldt project (Kansas; note on U.S. landowner-held rights): https://458energy.com/us-humboldt/
Hydroma, Natural Hydrogen: https://hydroma.ca/activities-natural-hydrogen/
Osselin et al., “Orange hydrogen is the new green,” Nature Geoscience (2022): https://doi.org/10.1038/s41561-022-01043-9
Hydrogen Science Coalition on the Oman stimulation pilot (Jun 2026): https://h2sciencecoalition.com/blog/stimulated-hydrogen-a-clever-idea-but-can-we-actually-get-the-gas-out/
TipRanks summary of HyTerra's McCoy-1 announcement (Aug 2026) (secondary source): https://www.tipranks.com/news/company-announcements/hyterras-mccoy-1-test-refines-strategy-for-kansas-hydrogen-plays
Hearon et al., data release for PP 1900 (CC0): https://doi.org/10.5066/P13WCG5U
Distribution of USGS Code: https://www.usgs.gov/products/software/software-management/distribution-usgs-code